Biological research often requires the use of fluorescent labeled proteins. Either Cu(I)-catalyzed azide-alkyne cycloaddition (CuAAC) or strain-promoted alkyne-azide cycloaddition (SPAAC) can be used to achieve such labeling.
Rapid, highly specific, and efficient click chemistry reactions are suitable for specific biomolecule labeling in complex biological systems. However, it is known that cyclooctynes used for SPAAC can react with cysteine SH-groups in a process that does not involve azide. This thiol-yne addition with cysteine SH groups is responsible for most of the azide-independent polypeptide labeling [Remon van Geel at al., Bioconjugate Chem. 2012, 23, 392−398]. But it is important to note that the rate of this reaction is about two orders of magnitude lower than spAAC [Dommerholt at al., Topics in Current Chemistry. 2016, 374].
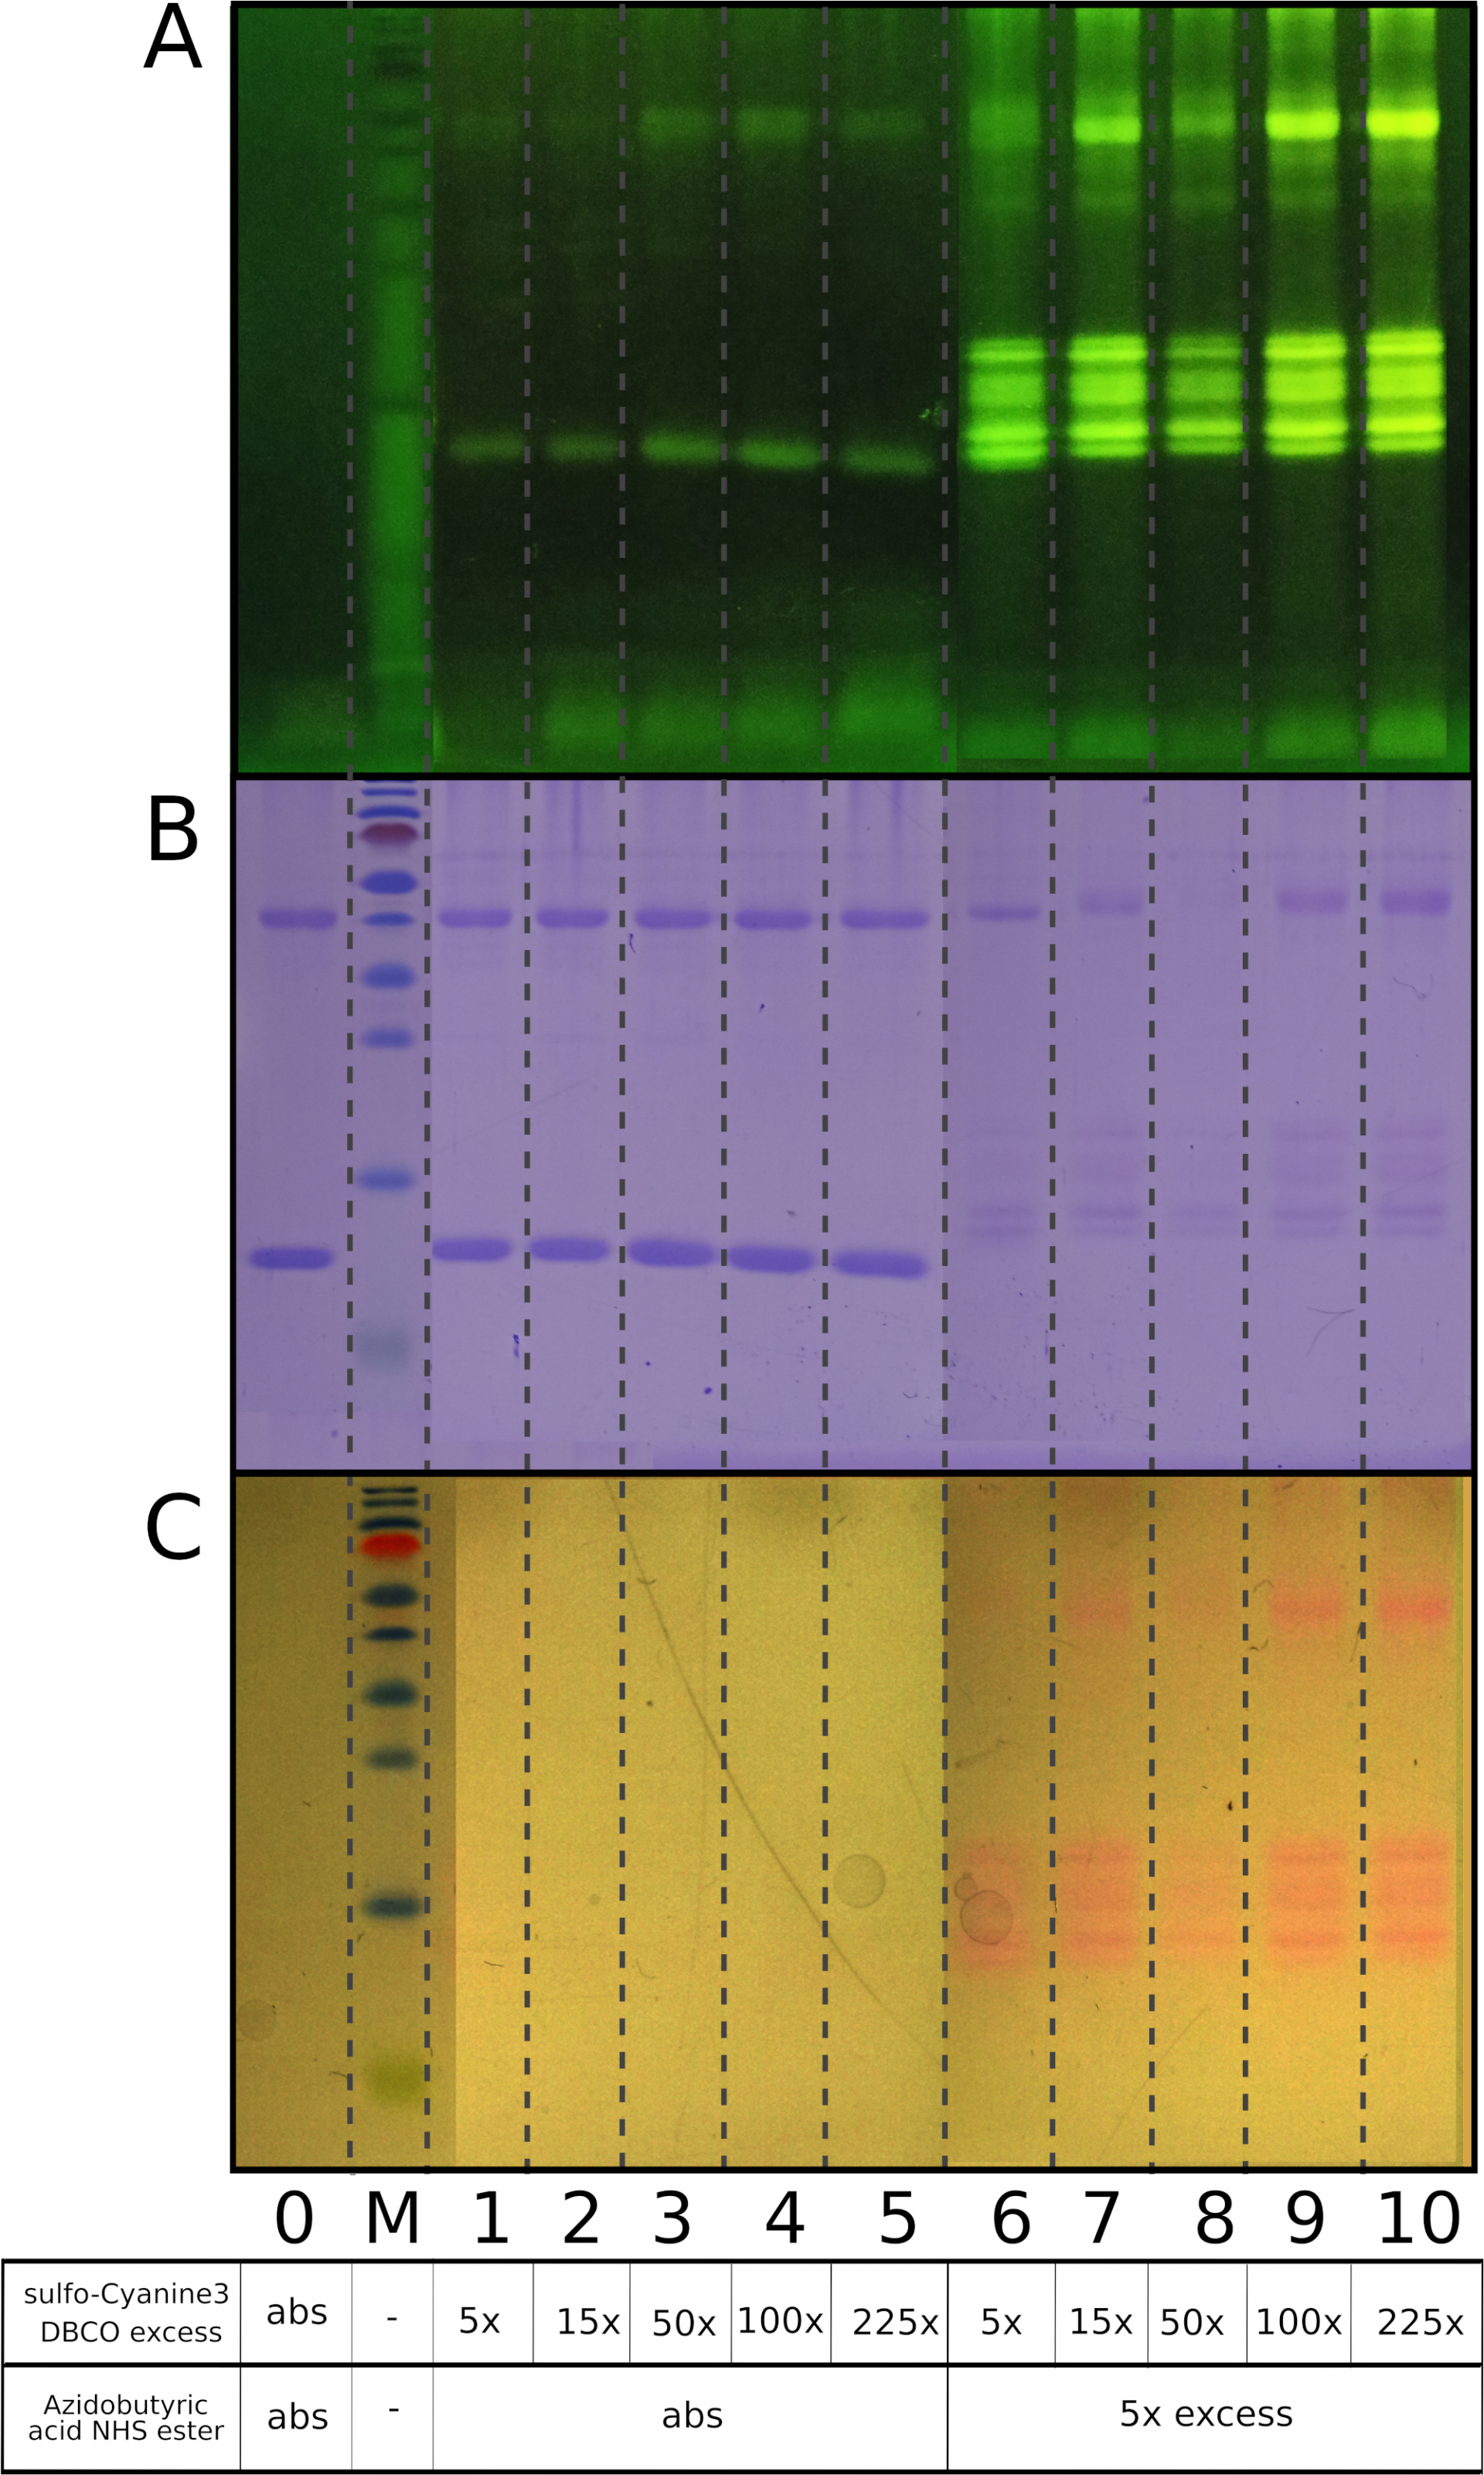
Different rates of SPAAC and nonspecific thiol-yne addition of cyclooctynes with cysteine SH groups.
As can be seen from the figure, samples with proteins that do not contain azide (lanes 1-5) display weak nonspecific protein labeling. Samples that were preincubated with 5x excess of Azidobutyric acid NHS ester for 1 hour at room temperature (lanes 6-10) show high fluorescent intensity as a result of specific spAAC reaction. The range of sulfo-Cyanine3 DBCO excess is 5x-225x.
A) Visualization under UV light, B) Coomassie R250 staining, C) Visualization under visible light
0 - a mixture of native lysozyme and ovalbumin, M - PageRuler Prestained Protein Ladder, Thermo Scientific, Abs – an absence of appropriate reagent
It turned out that the nonspecific labeling of proteins also occurs as a result of a CuAAC. A reaction of native proteins with terminal alkynes in the presence of THPTA/Cu (I) as a catalyst results in some weak nonspecific protein labeling, whereas in the absence of a catalyst, this effect is not observed at all.
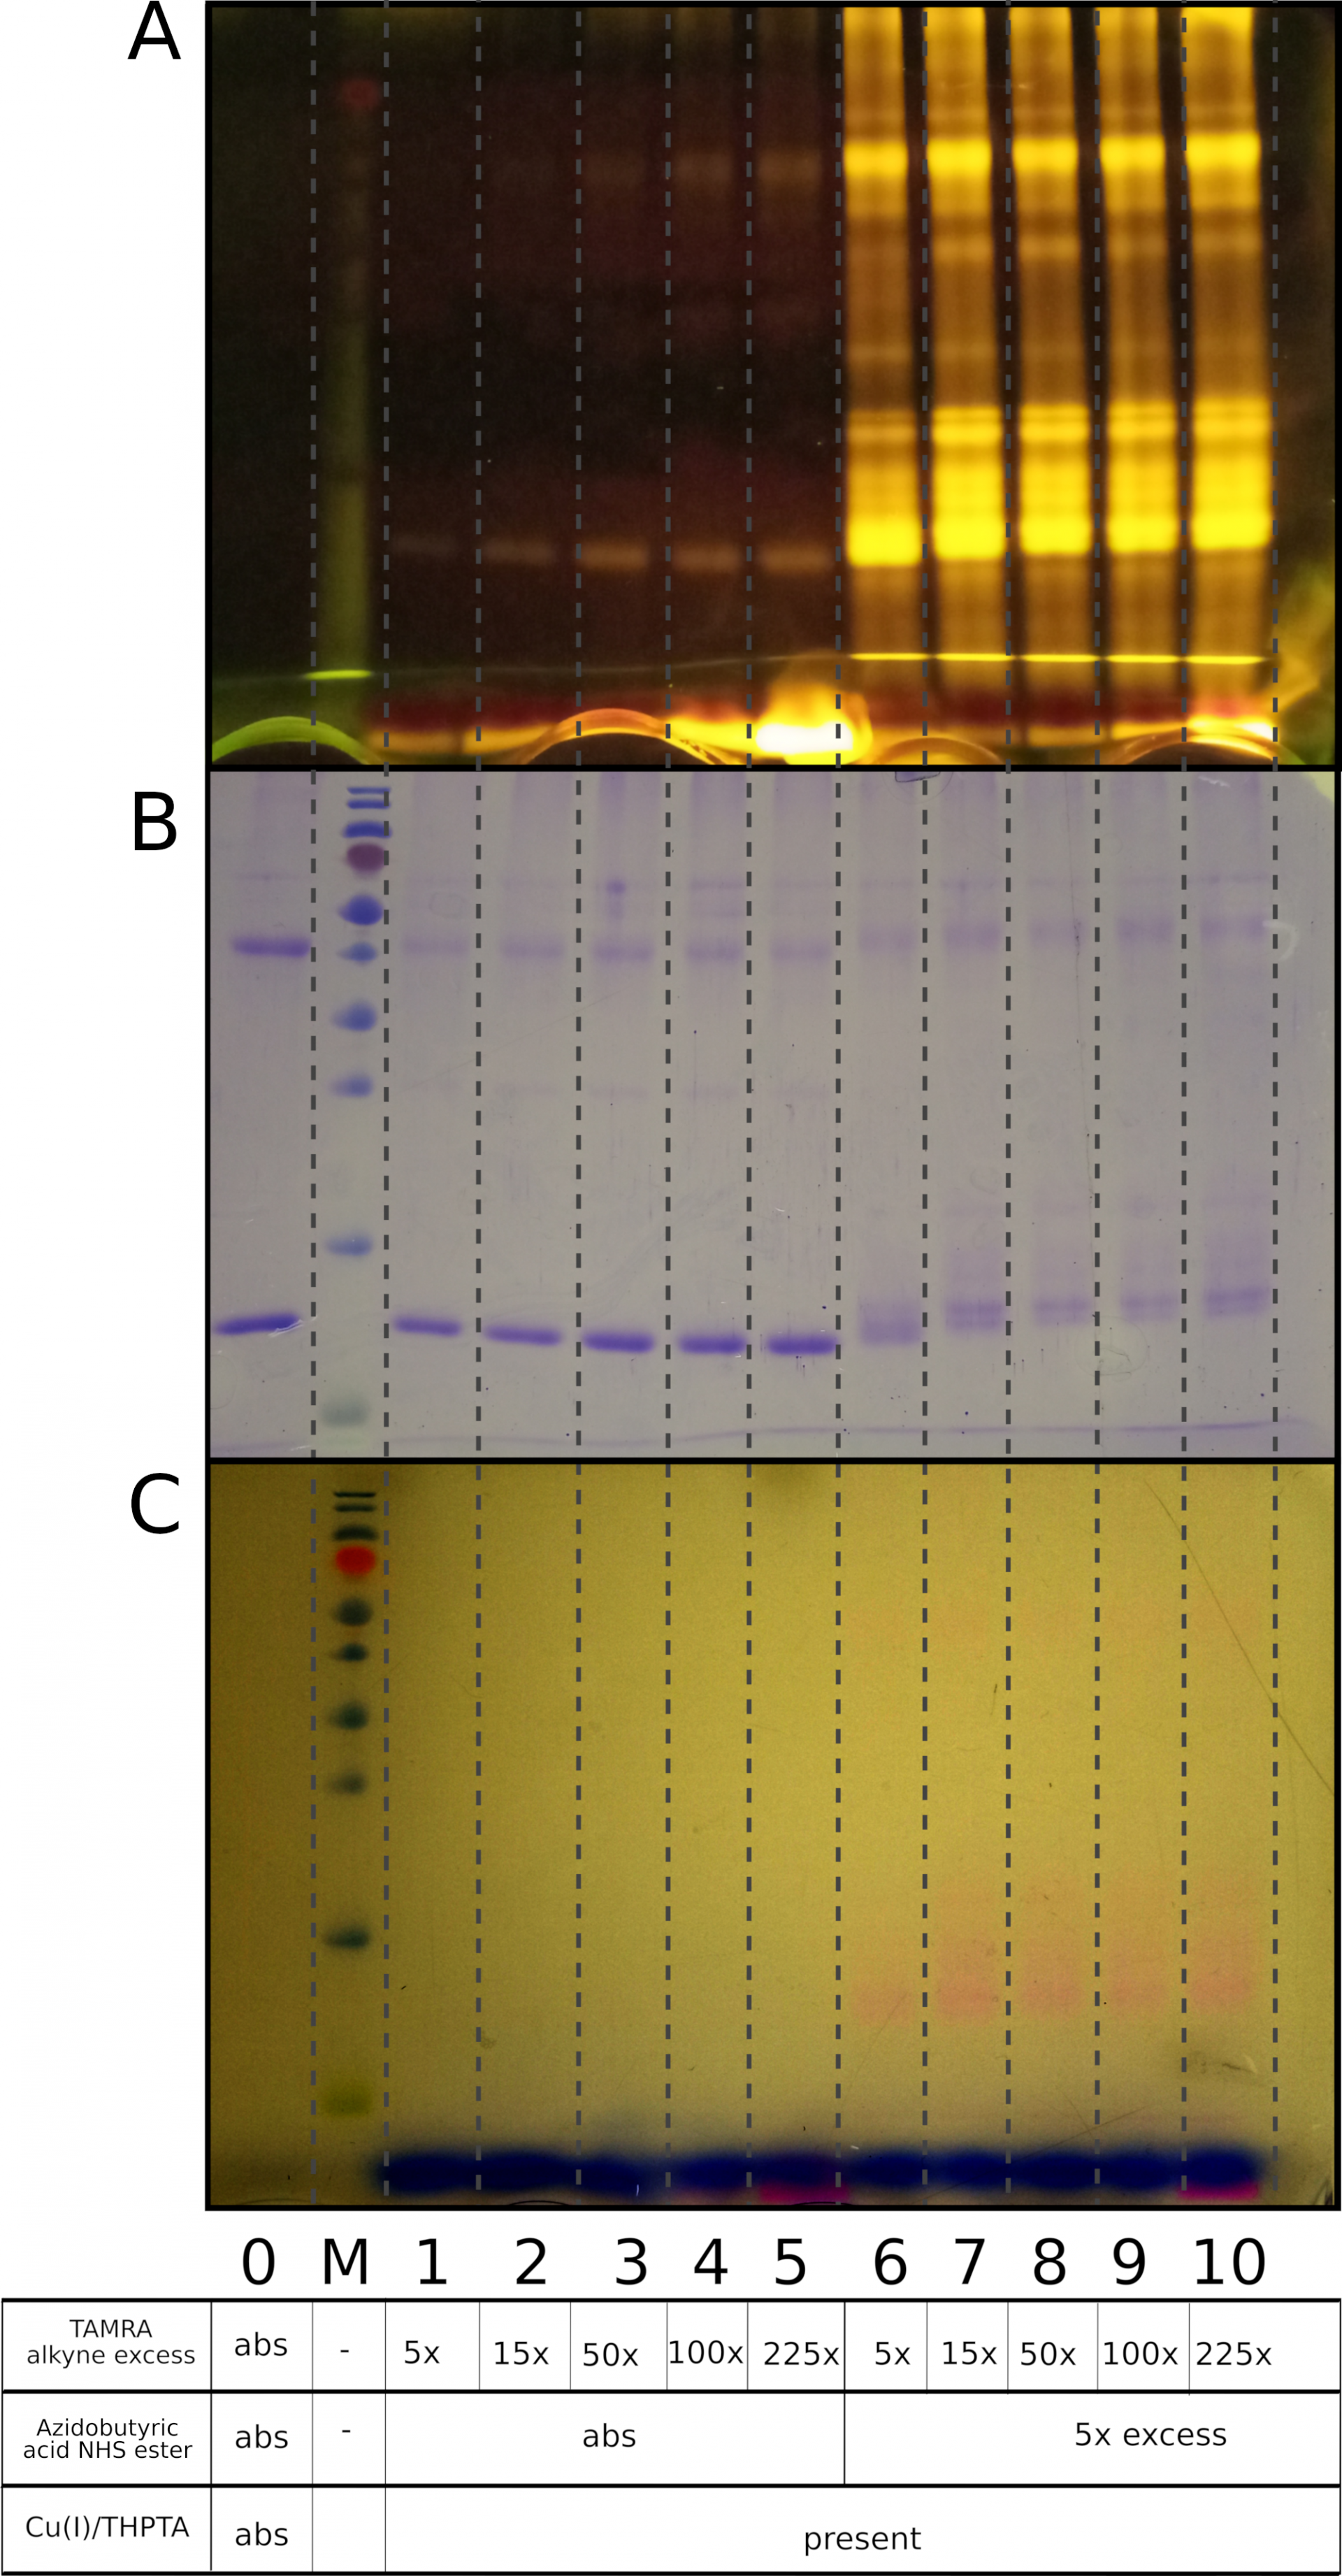
A comparison of CuAAC labeling vs non-specific reaction using TAMRA alkyne and THPTA/Cu (I)
Samples with proteins that do not contain azide (lanes 1-5) display weak nonspecific protein labeling (in a concentration-dependent manner, the fluorescence correlates with TAMRA alkyne excess). Samples that were preincubated with 5x excess of Azidobutyric acid NHS ester for 1 hour at room temperature (lanes 6-10) show high fluorescence intensity as a result of a specific CuAAC reaction. The range of TAMRA alkyne excess is 5x-225x.
A) Visualization under UV light, B) Coomassie R250 staining, C) Visualization under visible light
0 - a mixture of native lysozyme and ovalbumin, M - PageRuler Prestained Protein Ladder, Thermo Scientific, Abs – an absence of appropriate reagent
CuAAC labeling vs non-specific reaction with Sulfo-Cyanine3 alkyne in the presence of THPTA/Cu (I)
Similarly, samples with proteins that do not contain azide (lanes 1-5) display weak nonspecific protein labeling (according to Sulfo-Cyanine3 alkyne excess). Samples that were preincubated with 5x excess of Azidobutyric acid NHS ester for 1 hour at room temperature (lanes 6-10) show high fluorescence intensity as a result of a specific CuAAC reaction. The Sulfo-Cyanine3 alkyne is in excess, ranging from 5x to 225x.
A) Visualization under UV light, B) Coomassie R250 staining, C) Visualization under visible light
0 - a mixture of native lysozyme and ovalbumin, M - PageRuler Prestained Protein Ladder, Thermo Scientific, Abs – an absence of appropriate reagent
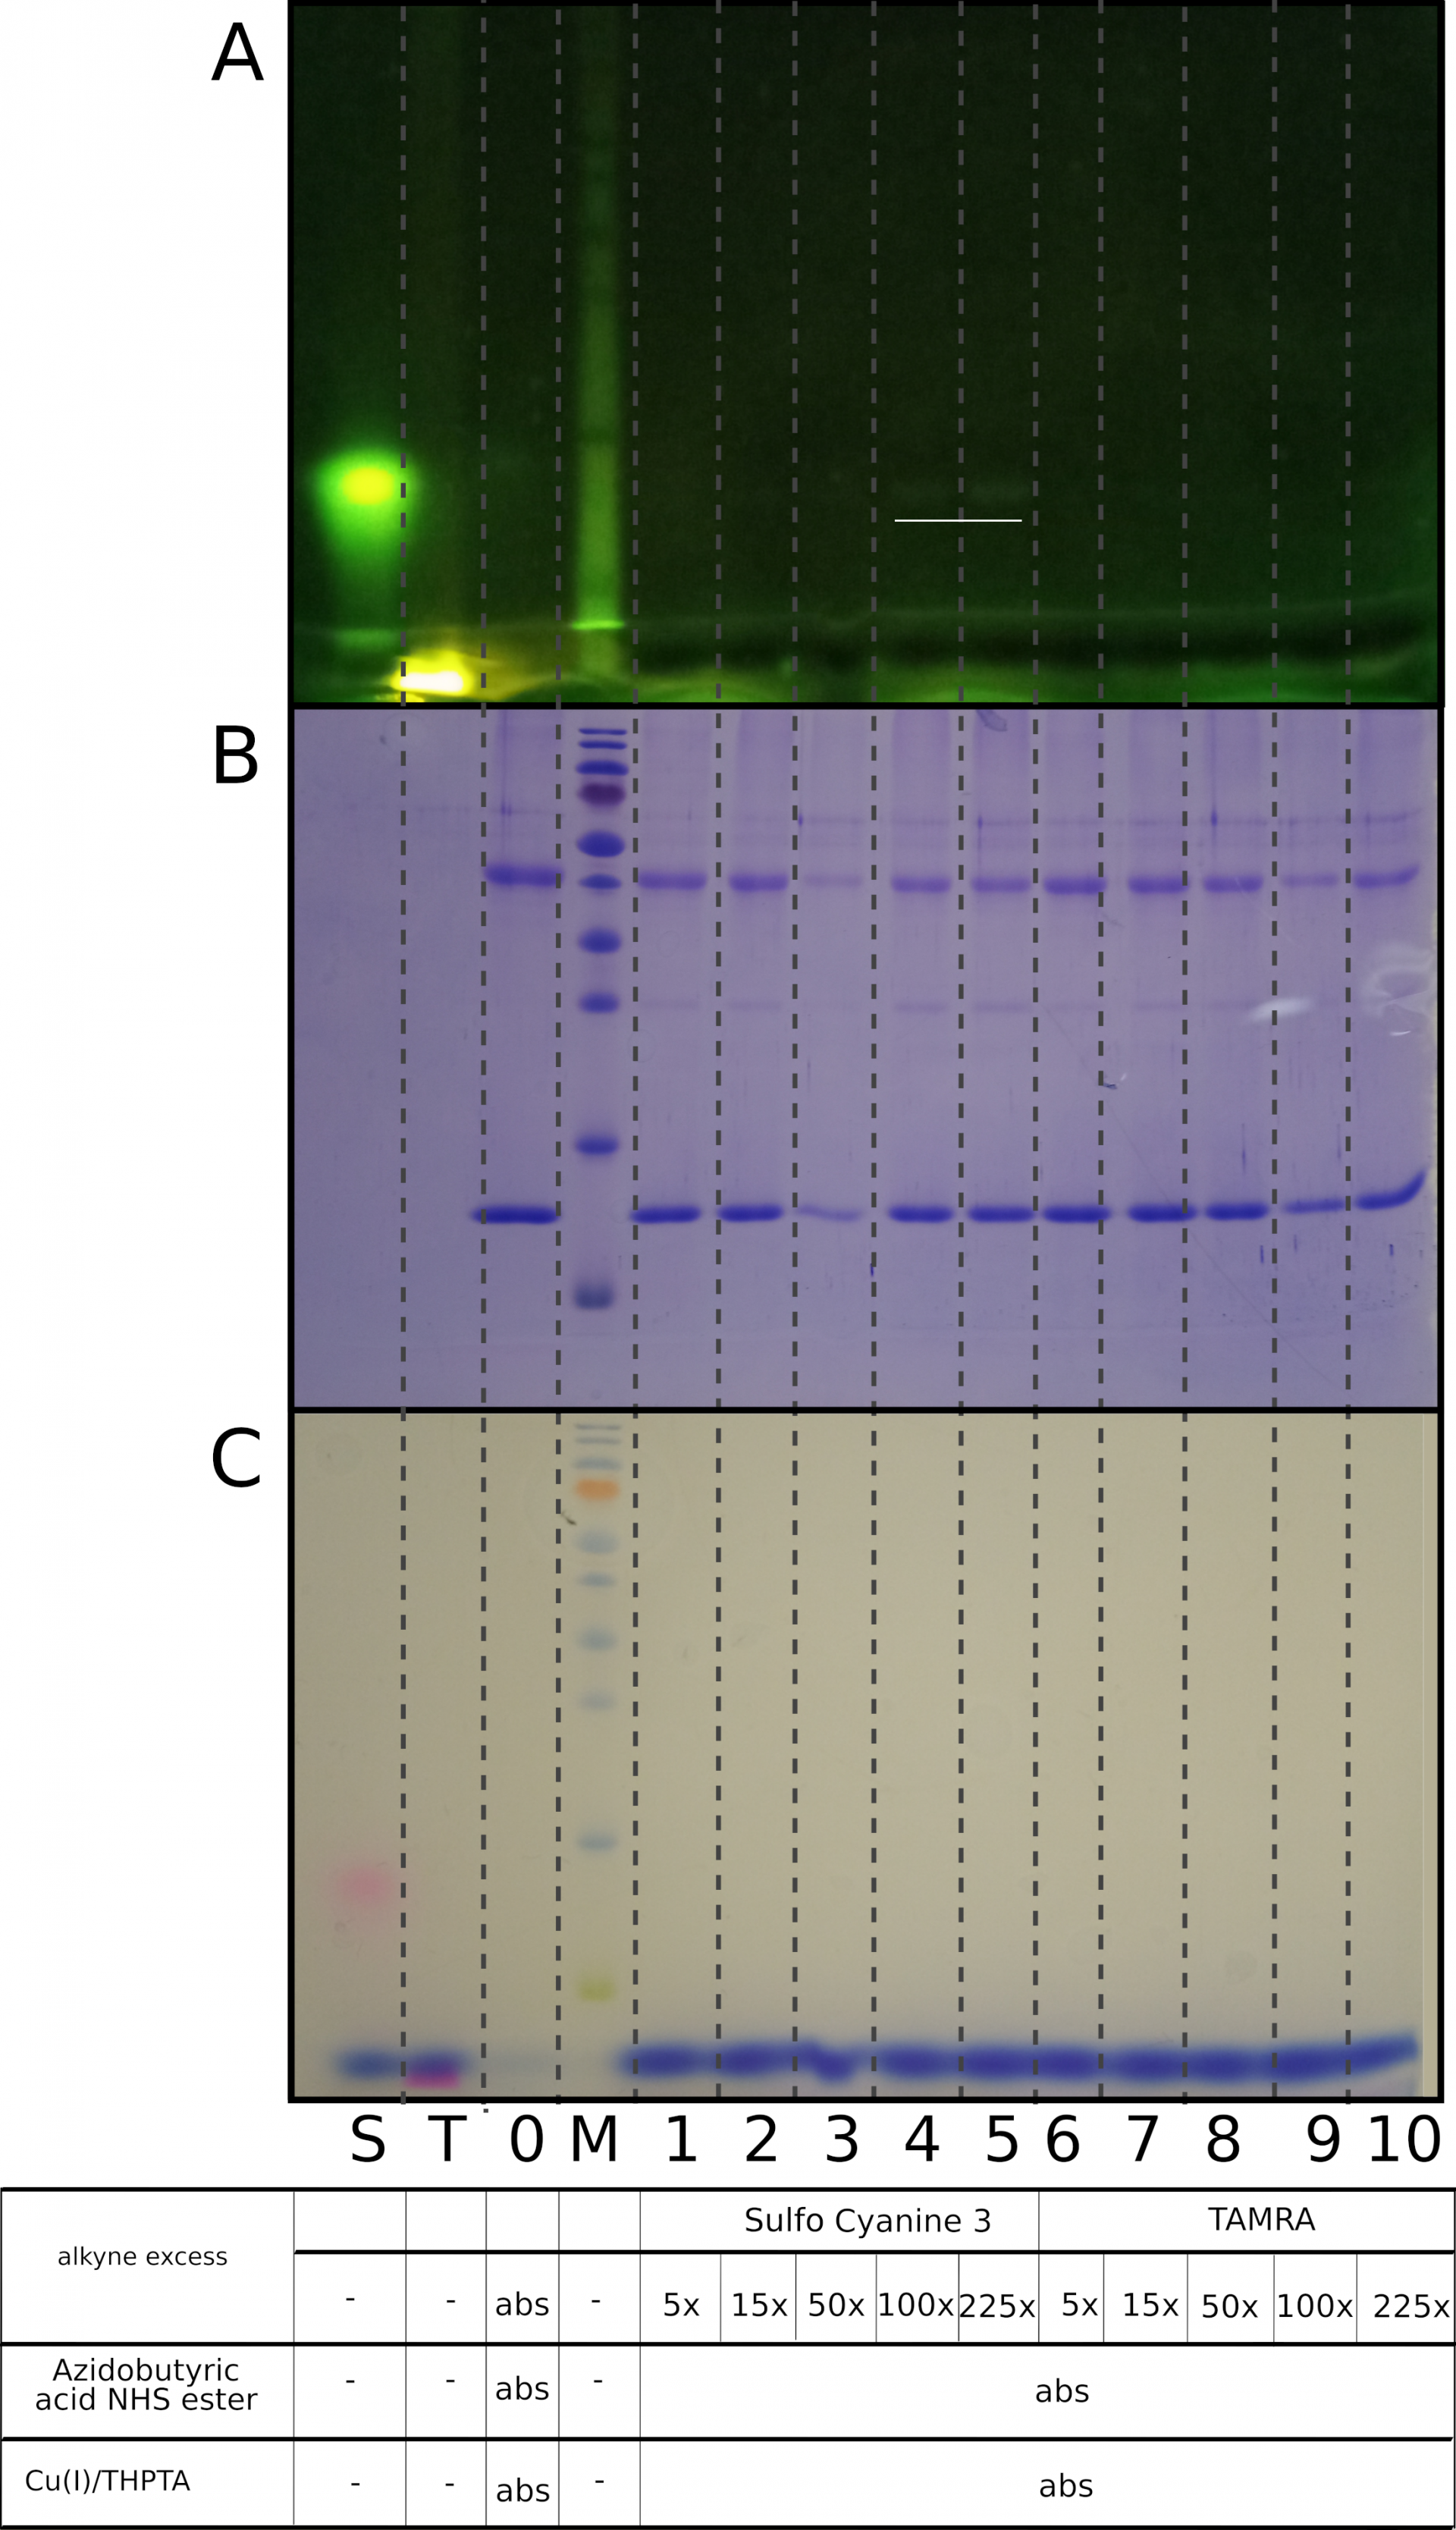
Non-specific reaction with alkynes seems to be Cu(I)-dependent
Both samples containing sulfo-Cyanine3 alkyne (lanes 1-5) and samples containing TAMRA alkyne (lanes 6-10) do not display any nonspecific protein labeling in the absence of a catalyst THPTA/Cu (I). The range of alkyne excess is 5x to 225x. Lanes 4-5 with a 100x and 225x excess of sulfo-Cyanine3 alkyne demonstrate traces of unbound fluorophore (underlined).
A) Visualization under UV light, B) Coomassie R250 staining, C) Visualization under visible light
0 - a mixture of native lysozyme and ovalbumin, M - PageRuler Prestained Protein Ladder, Thermo Scientific, S- Sulfo-Cyanine3 alkyne, T- TAMRA alkyne
Therefore,
1. Click chemistry reactions, both copper-free, and copper-catalyzed, are very specific, but there are non-specific interactions between proteins and alkyne reagents, as well as between proteins and cycloalkyne reagents.
2. In the case of cycloalkynes (copper-free click chemistry), the reaction has been described in the literature, and it mostly affects SH groups of cysteines.
3. In copper-catalyzed reactions, alkynes can react with unidentified protein functional groups or somehow bind non-specifically. The reaction is mediated by copper.
So far, we have not established the nature of the interaction of terminal alkynes with proteins that do not contain azides.
Thus, if weak labeling is observed during your experiment, it might be a result of non-specific binding. To troubleshoot the reaction, we recommend performing a well-reproducible experiment for comparison purposes (we suggest Bovine Serum Albumin or ovalbumin). Label the protein with an azide using different excess reagents (for example, Azidobutyric acid NHS ester). Then, carry out reactions of both proteins bearing an azide functionality and native protein with different excess of the alkyne-modified fluorophore. The difference in labeling intensity between specific and non-specific reactions will be clearly noticeable.
It should also be noted that unbound dye migrates during electrophoresis as well. Its mobility is similar to that of proteins.
Procedure.
1. Bicarbonate buffer (100 mM, pH 8.3) was prepared by weighting sodium bicarbonate (0.42 g) and dissolving it in mQ water (50 mL).
2. Mixture of proteins was prepared by weighting ovalbumin (10 mg) and lysozyme (10 mg) and dissolving them in bicarbonate buffer.
3. Solution of Azidobutyric acid NHS ester (100 mM) was prepared by weighting Azidobutyric acid NHS ester (10 mg) and dissolving it in DMSO (442 μL).
4. A mixture of lysozyme and ovalbumin (2 mg/mL of each protein, 1 ml) was divided into two equal parts.
5. To the first half was added 5x excess of Azidobutyric acid NHS ester (5 µL of 100 mM solution in DMSO), mixed, and incubated for 1 hour at room temperature. The second part of protein mixture was left without any modification.
6. Solutions of alkyne-modified fluorophores (15 mМ) were prepared by weighting fluorophore reagent (5 mg) and dissolving:
· In DMSO (784.5 µL) for sulfo-Cyanine3 DBCO;
· In DMSO (1083 µL) for sulfo-Cyanine3 alkyne;
· In DMSO (1603 µL) for TAMRA alkyne;
7. An excess of sulfo-Cyanine3 DBCO, TAMRA alkyne, sulfo-Cyanine3 alkyne (0.6, 1.5, 3.3, 6.6, 15 μL of 15 mM solution in DMSO to get 5х, 15х, 50х, 100х, 225х excess, respectively) was added to protein mixture (20 µL) (separately proteins bearing an azide functionality and native proteins).
8. (only for CuAAC: TAMRA alkyne and sulfo-Cyanine3 alkyne react in the presence of a catalyst) Solutions of THPTA ligand (50 mM), copper (II) sulfate pentahydrate (20 mM) and sodium ascorbate (100 mM) were prepared by dissolving separately THPTA ligand (22 mg), copper (II) sulfate pentahydrate (17.5 mg) and sodium ascorbate (20 mg) in deionized water (1 mL). The solution of THPTA ligand (10 μL) was mixed with the solution of copper (II) sulfate pentahydrate (50 μL), then deionized water (390 μL) and the solution of sodium ascorbate (50 μL) were added. The prepared final solution (20 μL) was added to each mixture of proteins with alkyne-modified fluorophores (TAMRA alkyne, sulfo-Cyanine3 alkyne) and mixed.
9. The mixtures were incubated for 1 hour at room temperature.
10. Proteins were precipitated with chloroform/methanol, and the pellet was washed three times with 90% methanol.
11. After air drying, the pellet was dissolved in reducing PAGE sample buffer (10 min, 95 °C). SDS-PAGE was performed in 15% running gel; the gel was visualized and photographed under UV light and stained with Coomassie R250 dye.


